Economics (McConnell), 18th Edition

Chapter 24: Measuring Domestic Output and National Income

Key Questions

1. Why do economists include only final goods in measuring GDP for a particular year? Why don't they include the value of the stocks and bonds bought and sold? Why don't they include the value of the used furniture bought and sold?

2. Below is a list of domestic output and national income figures for a certain year. All figures are in billions. The questions that follow ask you to determine the major national income measures by both the expenditures and the income approaches. The results you obtain with the different methods should be the same.

<a onClick="window.open('/olcweb/cgi/pluginpop.cgi?it=jpg::::/sites/dl/free/0025694212/668732/KeyQuestion_Ch06_Graph01.jpg','popWin', 'width=NaN,height=NaN,resizable,scrollbars');" href="#"><img valign="absmiddle" height="16" width="16" border="0" src="/olcweb/styles/shared/linkicons/image.gif"> (52.0K)</a>
<a onClick="window.open('/olcweb/cgi/pluginpop.cgi?it=jpg::::/sites/dl/free/0025694212/668732/KeyQuestion_Ch06_Graph02.jpg','popWin', 'width=NaN,height=NaN,resizable,scrollbars');" href="#"><img valign="absmiddle" height="16" width="16" border="0" src="/olcweb/styles/shared/linkicons/image.gif"> (57.0K)</a>
  1. Using the above data, determine GDP by both the expenditures and the income approaches. Then determine NDP.
  2. Now determine NI in two ways: first, by making the required additions or subtractions from NDP; and second, by adding up the types of income and taxes that make up NI.
  3. Adjust NI (from part b) as required to obtain PI.
  4. Adjust PI (from part c) as required to obtain DI.

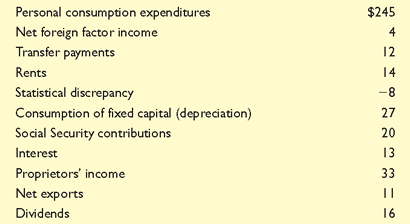
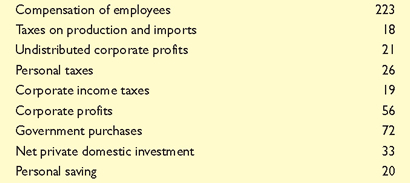
3. Suppose that in 1984 the total output in a single-good economy was 7000 buckets of chicken. Also suppose that in 1984 each bucket of chicken was priced at $10. Finally, assume that in 2000 the price per bucket of chicken was $16 and that 22,000 buckets were produced. Determine the GDP price index for 1984, using 2000 as the base year. By what percentage did the price level, as measured by this index, rise between 1984 and 2000? Use the two methods listed in Table 24.6 to determine real GDP for 1984 and 2000.

4. The following table shows nominal GDP and an appropriate price index for a group of selected years. Compute real GDP. Indicate in each calculation whether you are inflating or deflating the nominal GDP data.
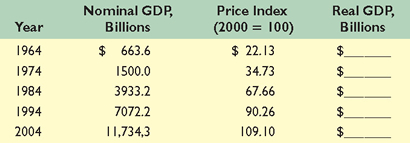
<a onClick="window.open('/olcweb/cgi/pluginpop.cgi?it=jpg::::/sites/dl/free/0025694212/668732/KeyQuestion_Ch06_Graph03.jpg','popWin', 'width=NaN,height=NaN,resizable,scrollbars');" href="#"><img valign="absmiddle" height="16" width="16" border="0" src="/olcweb/styles/shared/linkicons/image.gif"> (42.0K)</a>

Chapter 24 Key Question Solutions (38.0K)
Glencoe Online Learning CenterSocial Studies HomeProduct InfoSite MapContact Us

The McGraw-Hill CompaniesGlencoe