Economics (McConnell), 18th EditionChapter 9:
Pure CompetitionKey Questions1. Use the following demand schedule to determine total revenue and marginal revenue for each possible level of sales: 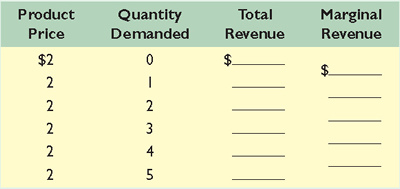 <a onClick="window.open('/olcweb/cgi/pluginpop.cgi?it=jpg::::/sites/dl/free/0025694212/668716/KeyQuestion_Ch21_Graph01.jpg','popWin', 'width=NaN,height=NaN,resizable,scrollbars');" href="#"><img valign="absmiddle" height="16" width="16" border="0" src="/olcweb/styles/shared/linkicons/image.gif"> (36.0K)</a> <a onClick="window.open('/olcweb/cgi/pluginpop.cgi?it=jpg::::/sites/dl/free/0025694212/668716/KeyQuestion_Ch21_Graph01.jpg','popWin', 'width=NaN,height=NaN,resizable,scrollbars');" href="#"><img valign="absmiddle" height="16" width="16" border="0" src="/olcweb/styles/shared/linkicons/image.gif"> (36.0K)</a>- What can you conclude about the structure of the industry in which this firm is operating? Explain.
- Graph the demand, total-revenue, and marginal-revenue curves for this firm.
- Why do the demand and marginal-revenue curves coincide?
- "Marginal revenue is the change in total revenue associated with additional units of output." Explain verbally and graphically, using the data in the table.
2. Assume the following cost data are for a purely competitive producer: 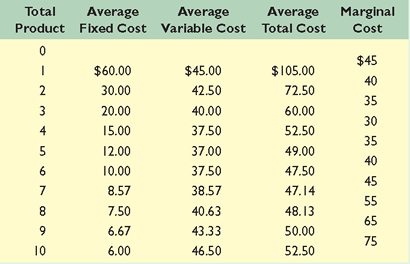 <a onClick="window.open('/olcweb/cgi/pluginpop.cgi?it=jpg::::/sites/dl/free/0025694212/668716/KeyQuestion_Ch21_Graph02.jpg','popWin', 'width=NaN,height=NaN,resizable,scrollbars');" href="#"><img valign="absmiddle" height="16" width="16" border="0" src="/olcweb/styles/shared/linkicons/image.gif"> (75.0K)</a> <a onClick="window.open('/olcweb/cgi/pluginpop.cgi?it=jpg::::/sites/dl/free/0025694212/668716/KeyQuestion_Ch21_Graph02.jpg','popWin', 'width=NaN,height=NaN,resizable,scrollbars');" href="#"><img valign="absmiddle" height="16" width="16" border="0" src="/olcweb/styles/shared/linkicons/image.gif"> (75.0K)</a>- At a product price of $56, will this firm produce in the short run? Why or why not? If it is preferable to produce, what will be the profit-maximizing or loss-minimizing output? Explain. What economic profit or loss will the firm realize per unit of output?
- Answer the relevant questions of 4a assuming product price is $41.
- Answer the relevant questions of 4a assuming product price is $32.
- In the table below, complete the short-run supply schedule for the firm (columns 1 and 2) and indicate the profit or loss incurred at each output (column 3).
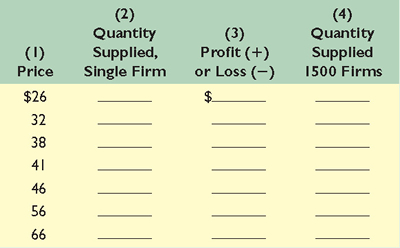 <a onClick="window.open('/olcweb/cgi/pluginpop.cgi?it=jpg::::/sites/dl/free/0025694212/668716/KeyQuestion_Ch21_Graph03.jpg','popWin', 'width=NaN,height=NaN,resizable,scrollbars');" href="#"><img valign="absmiddle" height="16" width="16" border="0" src="/olcweb/styles/shared/linkicons/image.gif"> (47.0K)</a> <a onClick="window.open('/olcweb/cgi/pluginpop.cgi?it=jpg::::/sites/dl/free/0025694212/668716/KeyQuestion_Ch21_Graph03.jpg','popWin', 'width=NaN,height=NaN,resizable,scrollbars');" href="#"><img valign="absmiddle" height="16" width="16" border="0" src="/olcweb/styles/shared/linkicons/image.gif"> (47.0K)</a> - Explain: "That segment of a competitive firm's marginal-cost curve which lies above its average-variable-cost curve constitutes the short-run supply curve for the firm." Illustrate graphically.
- Now assume that there are 1500 identical firms in this competitive industry; that is, there are 1500 firms, each of which has the cost data shown in the table. Calculate the industry supply schedule (column 4).
- Suppose the market demand data for the product are as follows:
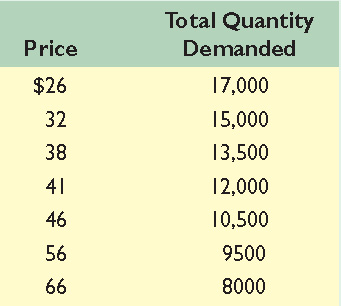 <a onClick="window.open('/olcweb/cgi/pluginpop.cgi?it=jpg::::/sites/dl/free/0025694212/384253/KeyQuestion_Ch21_Graph04.jpg','popWin', 'width=NaN,height=NaN,resizable,scrollbars');" href="#"><img valign="absmiddle" height="16" width="16" border="0" src="/olcweb/styles/shared/linkicons/image.gif"> (31.0K)</a> <a onClick="window.open('/olcweb/cgi/pluginpop.cgi?it=jpg::::/sites/dl/free/0025694212/384253/KeyQuestion_Ch21_Graph04.jpg','popWin', 'width=NaN,height=NaN,resizable,scrollbars');" href="#"><img valign="absmiddle" height="16" width="16" border="0" src="/olcweb/styles/shared/linkicons/image.gif"> (31.0K)</a>What will be the equilibrium price? What will be the equilibrium output for the industry? For each firm? What will profit or loss be per unit? Per firm? Will this industry expand or contract in the long run? 3. Using diagrams for both the industry and a representative firm, illustrate competitive long-run equilibrium. Assuming constant costs, employ these diagrams to show how (a) an increase and (b) a decrease in market demand will upset that long-run equilibrium. Trace graphically and describe verbally the adjustment processes by which long-run equilibrium is restored. Now rework your analysis for increasing- and decreasing-cost industries and compare the three long-run supply curves. 4. In long-run equilibrium, P = minimum ATC = MC. Of what significance for economic efficiency is the equality of P and minimum ATC? The equality of P and MC? Distinguish between productive efficiency and allocative efficiency in your answer.  Chapter 09 Key Question Solutions
(150.0K) Chapter 09 Key Question Solutions
(150.0K)
 |